Economics: Supply, Demand, Shift, and Equilibrium
Good Day P2G,
Our overall objectives were to be able to explain:
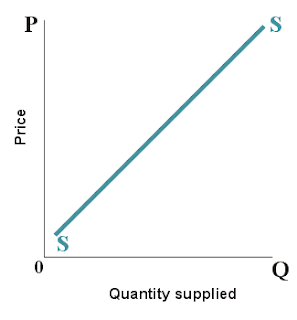
Below is the standard supply curve. Remember the seller always wants to sell more (quantity) at a higher price. Therefore the curve slopes from left to right, raising in price.

Now lets suppose that new research indicates that eating strawberries will make you more attractive to members of the opposite sex. Will consumers react to this news? Of course. It will change the perceived value of strawberries and increase the quantity of strawberries people are willing to buy at every price. Using the above numbers, suppose this new research triples the quantities people are willing to buy at each price. In other words, consumers are now willing to buy 60 pounds (rather than 20) at the $2 price and 90 pounds (rather than 30) at the $1 price. The demand curve will shift to the right. As shown below, the original demand curve (D1) has shifted to become a new demand curve (D2) or the curve has shifted to the left. This shift is beneficial to the buyer, but does not necessarily help the seller, unless the seller has a huge stockpile of strawberries in stock.

Supply Shift: Lets say that a manufacturer (seller) is producing leather shoes, but the cost of leather for those shoes has gone down. The supply curve would shift to the right, as the seller is able to produce more shoes at a lower price. Now lets assume that the opposite happened and the price of leather went up. The curve would shift to the left in order to demonstrate a lesser supply and a possible higher price per shoe.

Good Day P2G,
Hope all is well and that you have been reviewing your social studies notes. So what did we do in our TASC history class during the week of 2/29/2016?
Our overall objectives were to be able to explain:
- The factors that influence supply and demand
- What is market equilibrium
"The law of supply and demand is the theory explaining the interaction between the supply of a resource and the demand for that resource. The law of supply and demand defines the effect that the availability of a particular product and the desire (or demand) for that product has on price. Generally, if there is a low supply and a high demand, the price will be high. In contrast, the greater the supply and the lower the demand, the lower the price will be"
Government policies can also affect supply, by either taxing an item or providing a subsidy. A subsidy is a government payment that supports a business or a market. Subsidies increase supply because subsidies increase supplier’s profits. Typically, the government provides subsidies for the growth of corn to farmers. You can look at this from two ways, either the corn is now cheaper to grow or the corn is worth more money due to the government money or subsidy that is provided. In the end the farmer makes more money.
Source: Investopedia
SUPPLY
Supply must always be understood from the perspective of the seller. Sellers always want to sell more at the highest possible price.Government policies can also affect supply, by either taxing an item or providing a subsidy. A subsidy is a government payment that supports a business or a market. Subsidies increase supply because subsidies increase supplier’s profits. Typically, the government provides subsidies for the growth of corn to farmers. You can look at this from two ways, either the corn is now cheaper to grow or the corn is worth more money due to the government money or subsidy that is provided. In the end the farmer makes more money.
Below is the standard supply curve. Remember the seller always wants to sell more (quantity) at a higher price. Therefore the curve slopes from left to right, raising in price.
Any change in the cost of an input will affect the supply curve. An example of an input is a raw material. So if the price of corn goes up, the cost of popcorn will also go up as well.
DEMAND
Demand should be understood from the point of view of the buyer. Buyers want to buy more of an item at lower prices.
Demand can increase for many reasons, such as celebrity endorsement of a product, popularity, or availability. In many cases price is usually the biggest factor that a buyer considers. Their may be a demand for a product, but people may not be able to afford it therefore they will either not buy or substitute the product for a similar one. This is known as the substitution effect. The graph for the standard demand curve is represented below. Buyers always want to purchase more of a product at a lower price. This is why the demand curve slopes downward from left to right.
Equilibrium is when the Supply curve and the Demand curve intersect. The market is then said to be in equilibrium or all items that the seller wants to sell are being bought at a price that the buyer is satisfied with.
So what does it mean when the supply or demand curve shifts? On the TASC it is necessary to be able to understand the shifts or changes in both the demand and supply curve.
Demand Shift: Suppose people are willing to buy 20 pounds of strawberries at a price of $2, but are willing to buy 30 pounds if the price falls to $1. The relevant curve is drawn below:
Supply Shift: Lets say that a manufacturer (seller) is producing leather shoes, but the cost of leather for those shoes has gone down. The supply curve would shift to the right, as the seller is able to produce more shoes at a lower price. Now lets assume that the opposite happened and the price of leather went up. The curve would shift to the left in order to demonstrate a lesser supply and a possible higher price per shoe.
Below is a video that can further explain how specific factors effect supply and demand


Comments
Post a Comment